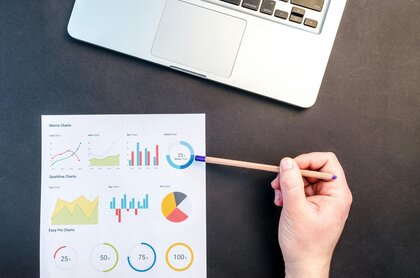
Visualize Data
Bar Chart, Pie Chart, Dot Plot
3.03 - Understand data visualizations.
🕒 45 Minute Activity
Overview
This lesson focuses on the key aspects of data, including how it's collected, stored, and analyzed. Students will explore techniques for manipulating data, creating visual representations, and understanding the ethical considerations involved in data usage.
Goals
Gain insights into data analysis and its significance.
Learn methods for collecting and storing data efficiently.
Apply foundational techniques for data manipulation.
Create and interpret data visualizations for clearer insights.
Recognize the importance of using data ethically and responsibly.