Visualize Data
Exploring and visualizing data insights
Organizing and preparing data for analysis
🕒 45 Minute Activity
Overview
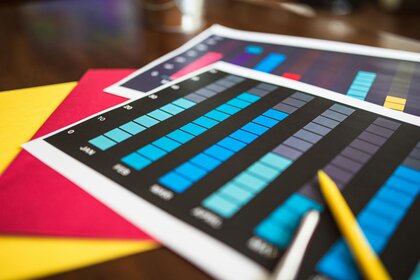
This module teaches students how to use visualization techniques to explore data and extract meaningful insights. It covers the use of statistical measures to create visual representations that highlight patterns, trends, and relationships in the data.
Goals
Apply data exploration and visualization techniques.
Create clear and meaningful data visualizations.
Utilize statistical measures to model and explore datasets.
Recognize relationships within data that are relevant to the problem at hand.